According to a recent X post by noted crypto analyst Titan of Crypto, Bitcoin (BTC) is fast approaching a golden cross formation – a bullish technical indicator that often precedes significant price appreciation. However, other analysts caution that a price correction could be on the horizon for the world’s largest digital asset.
Bitcoin Inches Closer To Golden Cross Formation
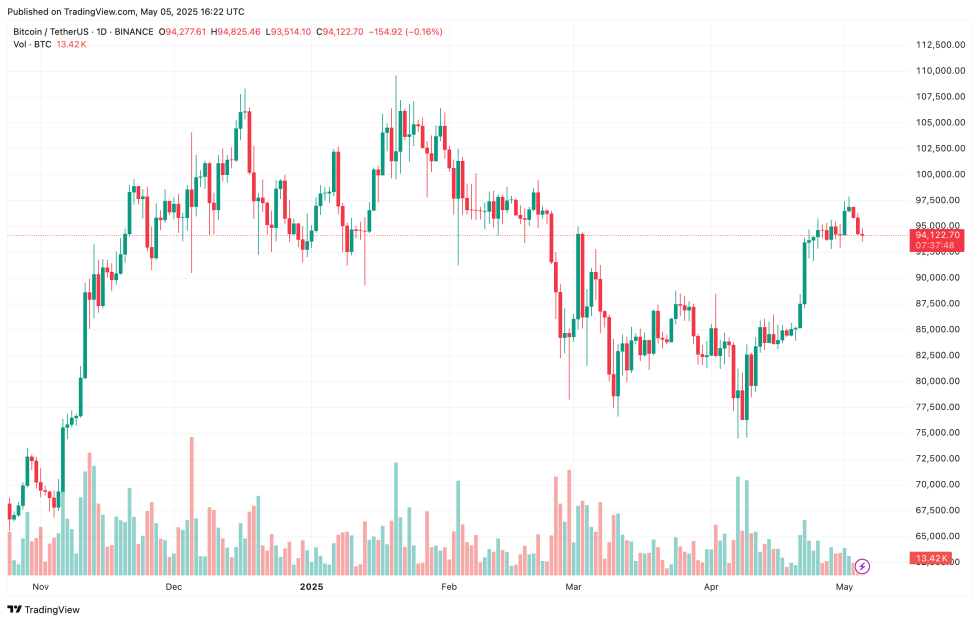
Bitcoin continues to trade within a narrow range between $92,000 and $98,000, offering limited directional cues for analysts. Still, some believe the flagship cryptocurrency may be gearing up for its next major move.
In a recent post, Titan of Crypto shared a chart showing that BTC is not only on track to form a golden cross but may also see its Moving Average Convergence Divergence (MACD) indicator flip bullish – a dual signal last seen in October 2024. At that time, Bitcoin surged significantly, bolstered by the victory of pro-crypto US presidential candidate Donald Trump.
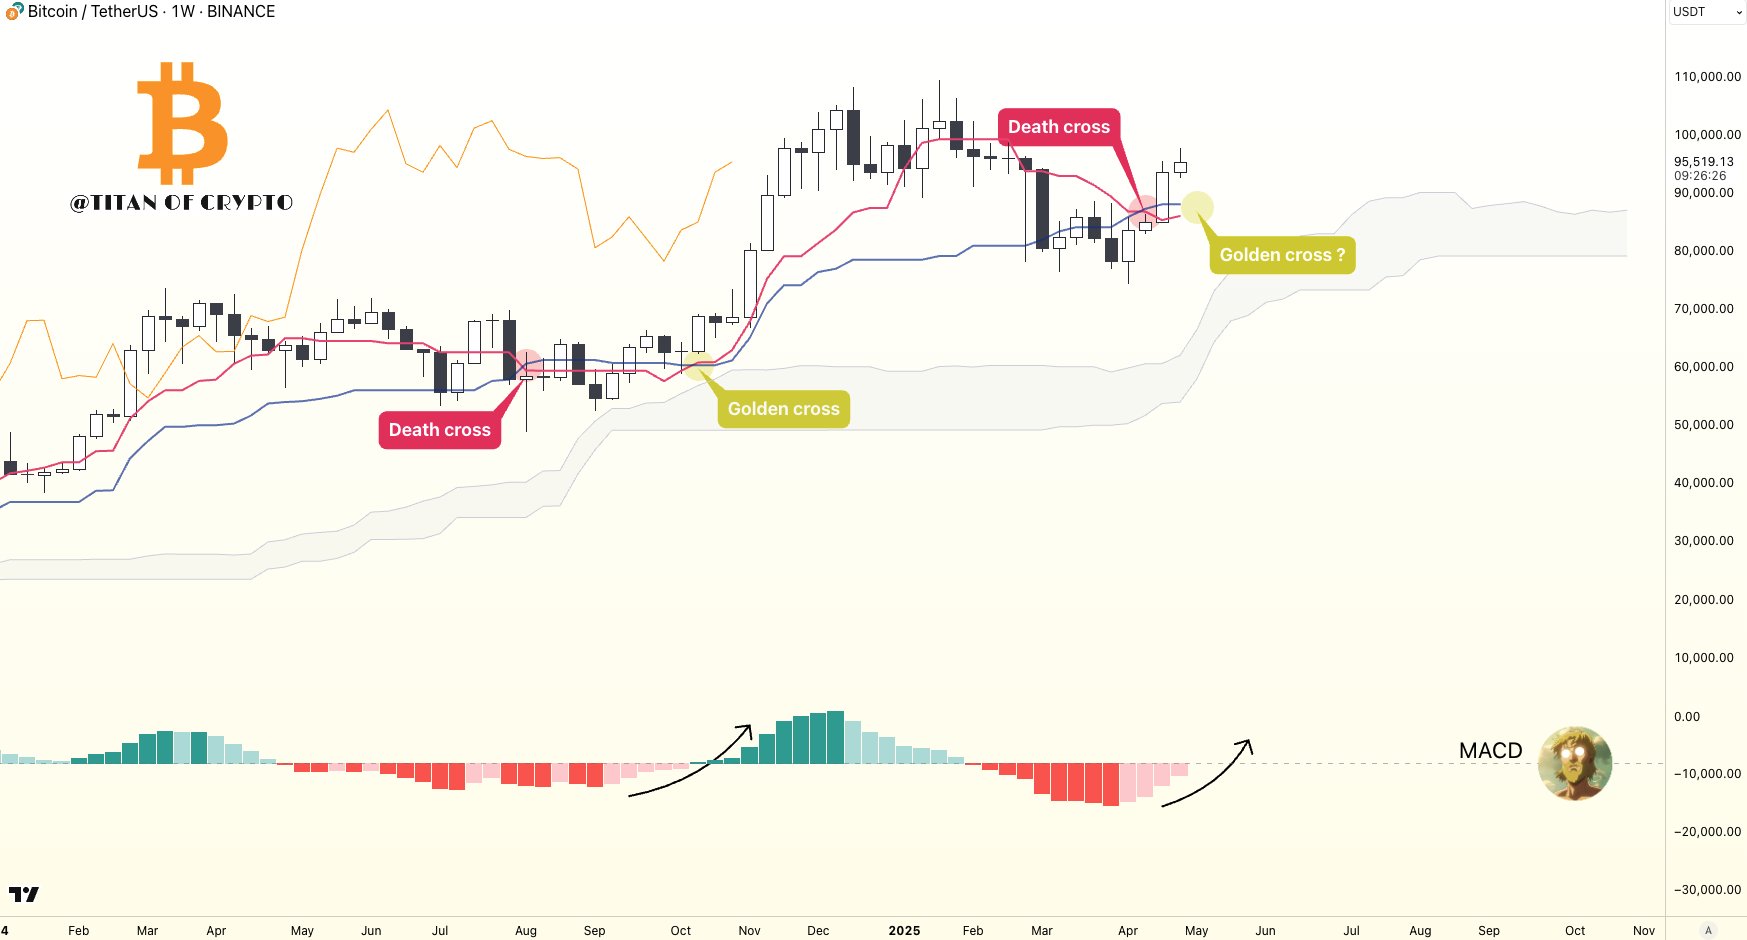
To explain, a golden cross is a bullish technical indicator that occurs when a short-term moving average – typically the 50-day MA – crosses above a long-term moving average – usually the 200-day MA. It signals potential upward momentum and is often seen as a sign of a trend reversal or continued rally.
Meanwhile, when the MACD turns bullish, it means the MACD line has crossed above the signal line, indicating a potential shift in momentum from bearish to bullish. This suggests that buying pressure may be increasing and a price uptrend could be starting.
Although BTC was recently rejected near the $98,000 level, crypto analysts, such as Rekt Capital, suggest this is expected behavior. For Bitcoin to break out to new all-time highs (ATH), it must first hold support at $93,500 and decisively break above $99,000.
Should it clear this resistance, BTC could face another rejection at $104,500. However, successfully flipping the $99,000 level into support would likely pave the way for a new ATH.
Not All Analysts Are Bullish
Despite the growing optimism, not all market observers are convinced a breakout is imminent. Prominent crypto analyst Ali Martinez pointed out that the TD Sequential indicator is currently flashing a sell signal on the 3-day BTC chart – a potential sign of short-term weakness.
Adding to the mixed outlook, BTC’s open interest in the futures market is now approaching historically high levels – a trend seen in previous bull markets that has typically led to price surge. At press time, BTC trades at $94,122, down 1.5% in the past 24 hours.

You can get bonuses upto $100 FREE BONUS when you:
💰 Install these recommended apps:
💲 SocialGood - 100% Crypto Back on Everyday Shopping
💲 xPortal - The DeFi For The Next Billion
💲 CryptoTab Browser - Lightweight, fast, and ready to mine!
💰 Register on these recommended exchanges:
🟡 Binance🟡 Bitfinex🟡 Bitmart🟡 Bittrex🟡 Bitget
🟡 CoinEx🟡 Crypto.com🟡 Gate.io🟡 Huobi🟡 Kucoin.


Comments